
RBSE Class 12th 2019 Economics-SS-10-2019-With Solution Previous Year Papers
Class 12th students hunting authentic previous year papers for Economics-SS-10-2019-With Solution (2019) land here for a reason: the paper below matches how RBSE assessments are remembered from that year. RBSE Solution does not mix years on one page; each combination gets its own notes.
Skim the overview sections, then work through the scanned pages. Pair this practice with RBSE books and solutions when you need to relearn a concept a question exposed.
Paper details
Quick reference for this previous year papers page — confirm board, class, and year & subject before you study.
| Board | RBSE |
|---|---|
| Class | Class 12th |
| Exam year | 2019 |
| Subject | Economics-SS-10-2019-With Solution |
| Resource type | Previous Year Papers |
| Category | RBSE Previous Year Question Papers |
| Website | RBSE Solution |
The table summarises this Previous Year Papers resource. Confirm RBSE, Class 12th, year 2019, and subject Economics-SS-10-2019-With Solution before studying.
RBSE Solution organises previous year papers so each URL carries chapter-specific guidance — better for students and for search engines than one generic paragraph for the whole class.
Turning 2019 papers into insight
One Economics-SS-10-2019-With Solution paper reveals style; several from the same year reveal pattern. After this page, open sibling subjects listed below to see whether marks cluster in certain units.
Keep rough work dated in your notebook. Examiners in Class 12th expect clear numbering even in practice sessions.
RBSE Class 12th 2019 Economics-SS-10-2019-With Solution
Scroll through the Previous Year Papers pages for Economics-SS-10-2019-With Solution (2019).
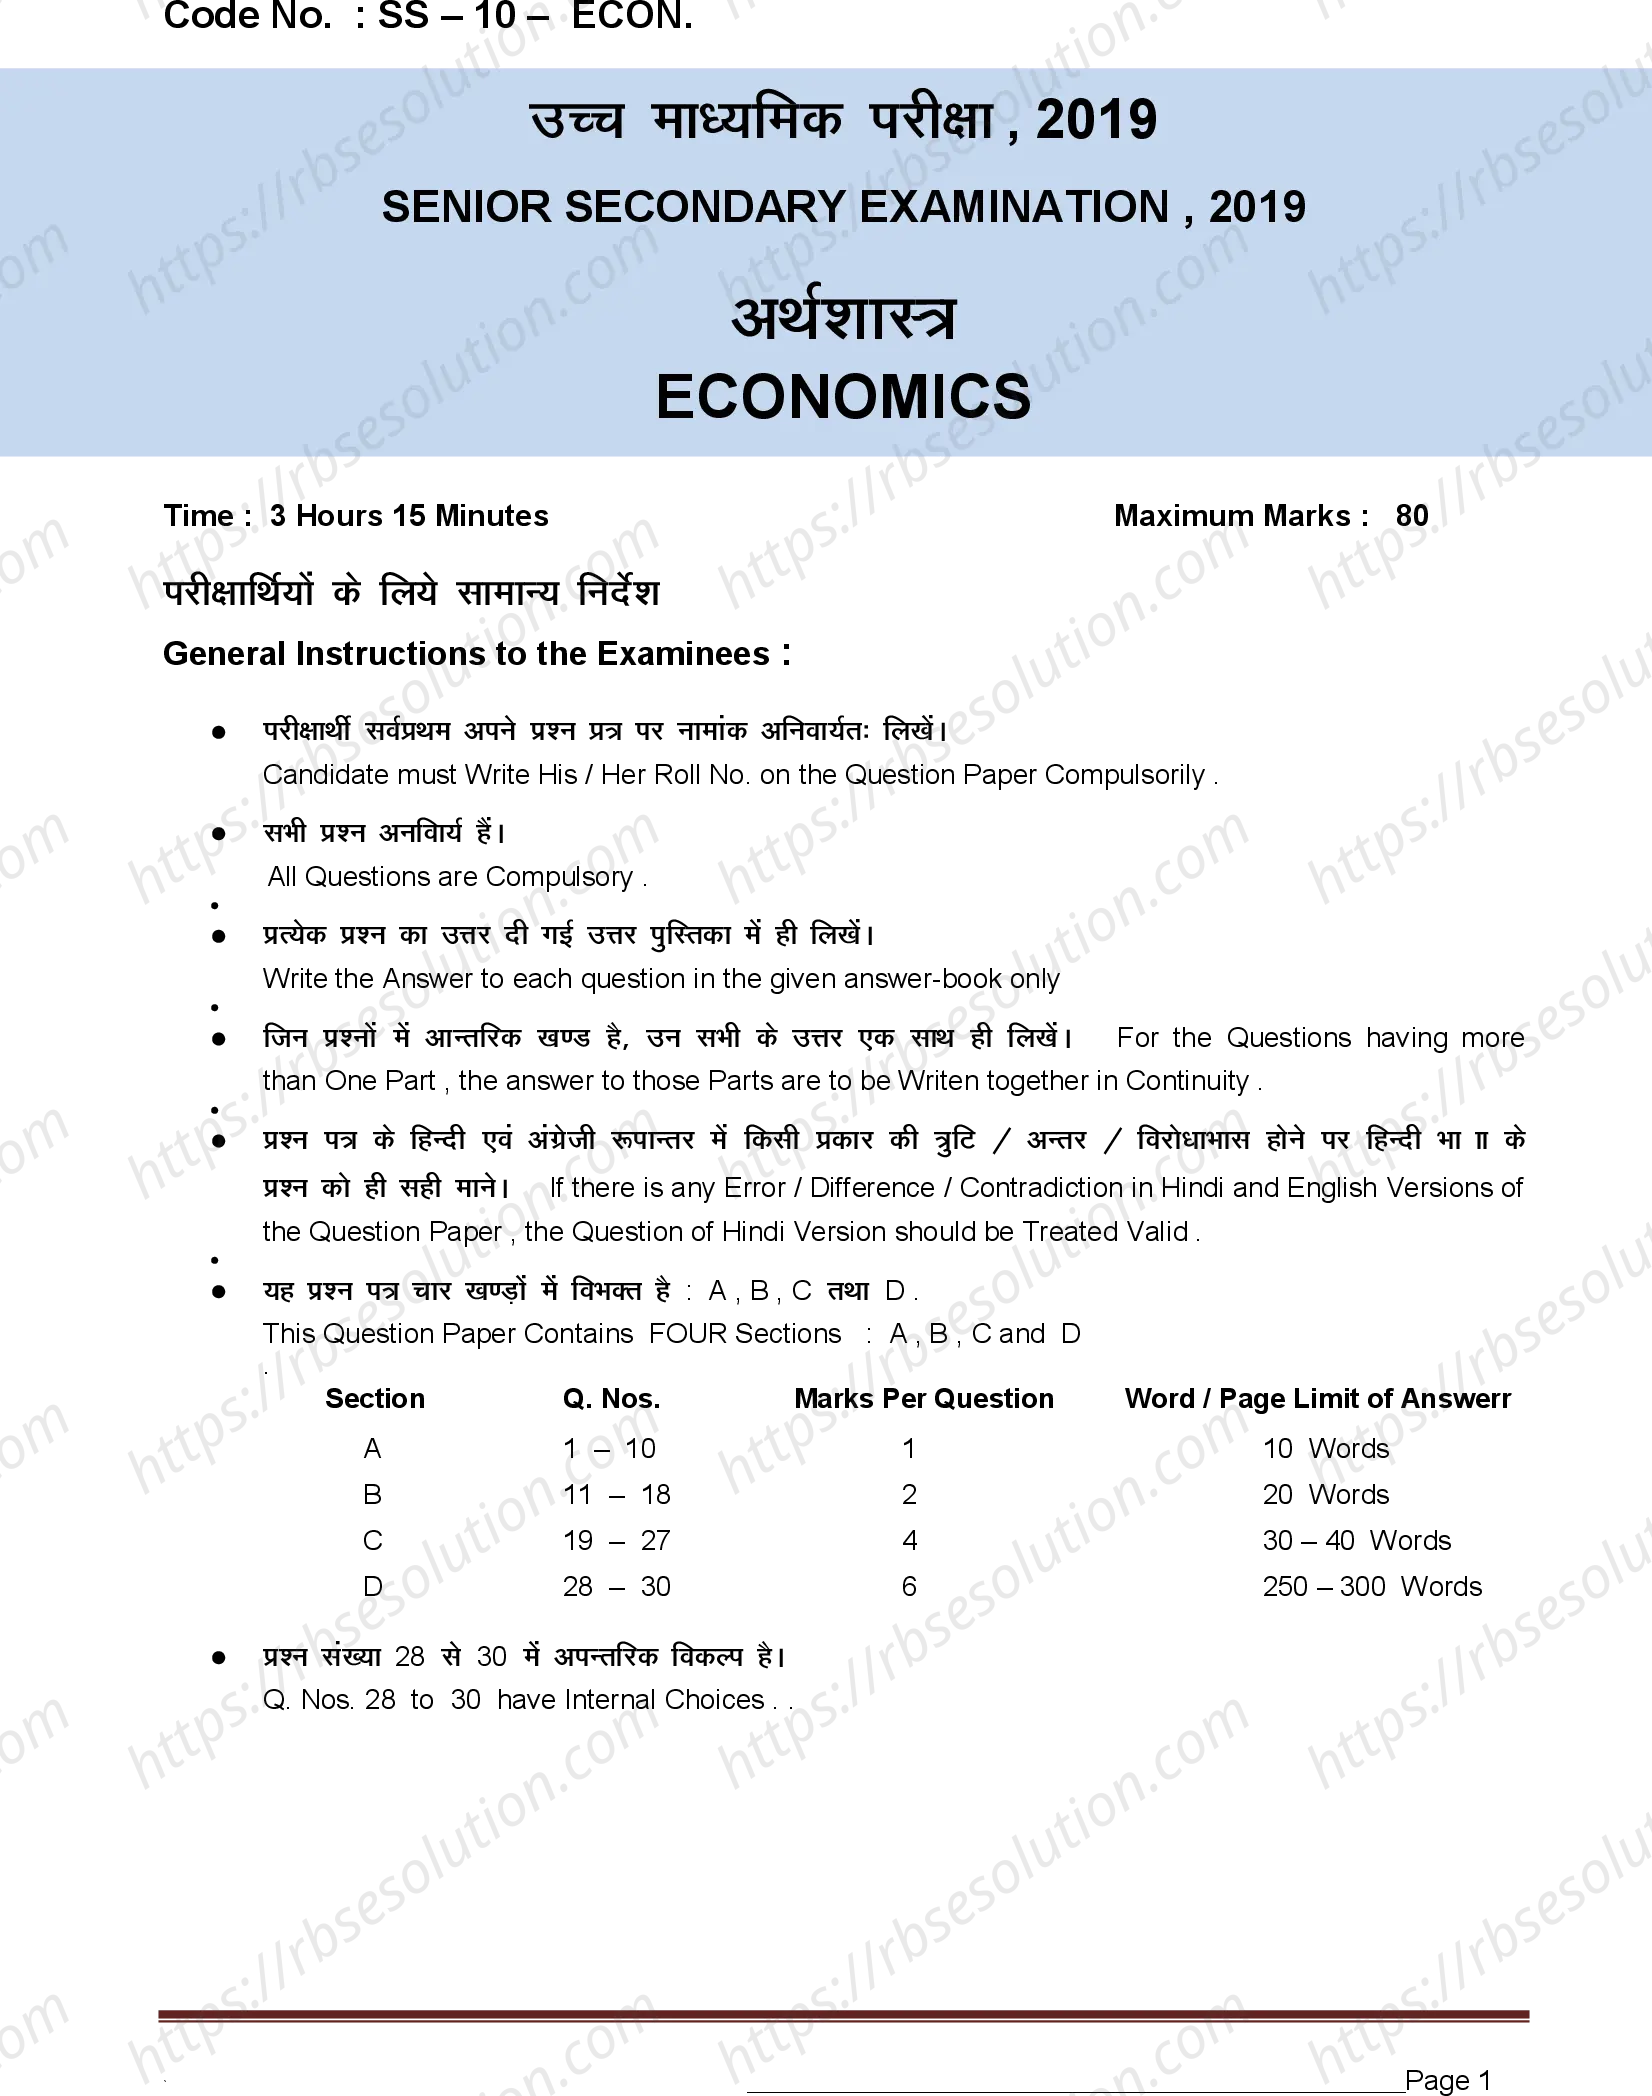


Rajasthan Board Class 12th Economics-SS-10-2019-With Solution 2019 solved Previous Year Question Papers
Code No. : SS—70—ECON.
उच्च माध्यमिक परीक्षा, 2019
SENIOR SECONDARY EXAMINATION, 2019
अर्थशास्त्र
ECONOMICS
Time : 3 Hours 5 Minutes Maximum Marks: 80
परीक्षार्थियों के लिये सामान्य निर्देश
General Instructions to the Examinees :
- परीक्षार्थी सर्वप्रथम अपने प्रश्न पत्र पर नामांक अनिवार्यतः लिखें।
Candidate must write his/her Roll No. on the Question Paper compulsorily. - सभी प्रश्न अनिवार्य हैं।
All Questions are compulsory. - प्रत्येक प्रश्न का उत्तर दी गई उत्तर पुस्तिका में ही लिखें।
Write the answer to each question in the given answer-book only. - जिन प्रश्नों में आन्तरिक खण्ड है, उन सभी के उत्तर एक साथ ही लिखें।
For the questions having more than one part, the answers to those parts are to be written together in continuity. - प्रश्न पत्र के हिन्दी एवं अंग्रेजी रूपान्तर में किसी प्रकार की त्रुटि/अन्तर/विरोधाभास होने पर हिन्दी भाग के प्रश्न को ही सही मानें।
If there is any error/difference/contradiction in Hindi and English versions of the question paper, the question of Hindi version should be treated valid.
यह प्रश्न पत्र चार खण्डों में विभक्त है : A, B, C तथा D.
This question paper contains FOUR Sections : A, B, C and D.
| Section | Q. Nos. | Marks Per Question | Word / Page Limit of Answer |
|---|---|---|---|
| A | 1 – 10 | 1 | 40 Words |
| B | 11 – 18 | 2 | 20 Words |
| C | 19 – 27 | 4 | 30 – 40 Words |
| D | 28 – 30 | 6 | 250 – 300 Words |
प्रश्न संख्या 28 से 30 में आन्तरिक विकल्प है।
Q. Nos. 28 to 30 have internal choices.
Page 1
७१.
अर्थशास्त्र की किस शाखा में हम व्यक्तिगत इकाई का अध्ययन करते है ?
In which Branch of Economics do we study of Individual Unit ?
[1 Mark]
उत्तर: सूक्ष्म अर्थशास्त्र में हम व्यक्तिगत इकाई का अध्ययन करते हैं।
In Micro Economics, we study of Individual Unit.
५२.
उत्पादन सम्भावना वक्र क्या है ?
What is the Production Possibility Curve (PPC) ?
[1 Mark]
उत्तर: एक उत्पादन-संभावना वक्र वह होता है जो दो वस्तुओं की उन सभी उत्पादन-संभावनाओं को दिखाता है जिन्हें एक अर्थव्यवस्था द्वारा दिए हुए साधनों एवं प्रौद्योगिकी के दिए हुए होने पर प्राप्त किया जा सकता है। संक्षेप में, यह चयन संयोगों को बताता है।
Production Possibility Curve (PPC) graphically represents the various possibilities of production of two commodities which can be produced with the given Resources and given State of Technology, assuming that the Resources are Fully Employed, Fully Utilized and Efficiently used.
Q3.
अर्थव्यवस्था से क्या तात्पर्य है ?
What is meant by an Economy ?
[1 Mark]
उत्तर: अर्थव्यवस्था का अर्थ किसी देश का वह सामाजिक, राजनैतिक व आर्थिक संगठन, ढांचा, संरचना या बनावट से होता है।
Economy is the Country's Social, Political and Economic Organ's after end Structure, wherein Performing Economic Activities in a Legal Way.
Q4.
लागत का अर्थ लिखिये।
Write the meaning of Cost.
[1 Mark]
उत्तर: फर्म अपने उत्पाद या निर्गत को तैयार करने में प्रयुक्त आगतों पर जो कुछ भी व्यय करती है, उसे ही अर्थशास्त्र में लागतें कहा जाता है।
Total Expenses, Incurred by a Firm in Producing a Commodity, Service and Output.
५५.
उत्पादन से क्या आशय है ?
What is meant by Production ?
[1 Mark]
उत्तर: उपयोगिता का सृजन ही उत्पादन है।
Creation of Utility is Production.
Page 2
प्रश्न 56. 'उपयोगिता का सृजन ही उत्पादन कहलाता है।' इस कथन को स्पष्ट कीजिए।
उत्तर: 'उपयोगिता का सृजन ही उत्पादन कहलाता है' – यह कथन उत्पादन की आधुनिक परिभाषा को दर्शाता है। उत्पादन का अर्थ केवल भौतिक वस्तुएँ बनाना नहीं है, बल्कि वस्तुओं और सेवाओं की उपयोगिता (Utility) में वृद्धि करना भी उत्पादन है। उपयोगिता सृजन के विभिन्न रूप हैं – रूप उपयोगिता (जैसे लकड़ी से फर्नीचर बनाना), स्थान उपयोगिता (जैसे माल को एक स्थान से दूसरे स्थान ले जाना), समय उपयोगिता (जैसे गोदाम में रखना), और स्वामित्व उपयोगिता (जैसे व्यापारी द्वारा वस्तु बेचना)। इस प्रकार, उत्पादन का अर्थ मानवीय आवश्यकताओं की संतुष्टि के लिए उपयोगिता का सृजन करना है।
प्रश्न 57. बाजार को परिभाषित कीजिये।
उत्तर: बाजार शब्द से अभिप्राय उस समस्त क्षेत्र से है जहाँ वस्तु के क्रेता एवं विक्रेता परस्पर किसी निश्चित कीमत पर एवं निश्चित समय पर उस वस्तु को खरीदने एवं बेचने के लिये तत्पर होते हैं। बाजार का अर्थ किसी भौतिक स्थान से नहीं, बल्कि क्रेता-विक्रेता के बीच संपर्क (व्यक्तिगत या फोन, टेलेक्स, फैक्स, ई-मेल आदि माध्यमों से) से है।
प्रश्न 58. दो मध्यवर्ती वस्तुओं के नाम लिखिये।
उत्तर: दो मध्यवर्ती वस्तुएँ निम्नलिखित हैं:
- गेहूँ (Wheat) – जिसका उपयोग आटा बनाने के लिए किया जाता है।
- कपास (Cotton) – जिसका उपयोग कपड़ा बनाने के लिए किया जाता है।
प्रश्न 59. वस्तु विनिमय प्रणाली से क्या अभिप्राय है?
उत्तर: वस्तु विनिमय प्रणाली (Barter System) से अभिप्राय मुद्रा के बिना वस्तुओं और सेवाओं के प्रत्यक्ष विनिमय या आदान-प्रदान से है। इसमें एक वस्तु को दूसरी वस्तु से सीधे बदला जाता है, जैसे गेहूँ के बदले कपड़ा लेना। यह प्रणाली मुद्रा के आविष्कार से पहले प्रचलित थी।
प्रश्न 60. राष्ट्रीय आय से आप क्या समझते हैं?
उत्तर: राष्ट्रीय आय (National Income) से अभिप्राय किसी देश में एक वर्ष की अवधि में उत्पादित समस्त अंतिम वस्तुओं तथा सेवाओं के बाजार मूल्य के योग से है। इसमें विदेशों से प्राप्त शुद्ध साधन आय (Net Factor Income from Abroad) भी शामिल होती है। दूसरे शब्दों में, किसी देश में एक वर्ष में आर्थिक क्रियाओं (विदेशी स्रोतों से शुद्ध आय सहित) से प्राप्त कुल आय को राष्ट्रीय आय कहते हैं।
प्रश्न 61. लोकतान्त्रिक व्यवस्था में सरकार बजट किसके समक्ष प्रस्तुत करती है?
उत्तर: लोकतान्त्रिक व्यवस्था में सरकार बजट संसद (Legislature) के समक्ष प्रस्तुत करती है। भारत में, केंद्र सरकार बजट लोकसभा में प्रस्तुत करती है, जहाँ इस पर चर्चा और अनुमोदन होता है।
Q4. आर्थिक विश्लेषण की किसी दो मान्यताओं को संक्षेप में समझाइये।
Explain briefly any TWO Assumptions of Economic Analysis. [2 Marks]
आर्थिक विश्लेषण की दो मान्यताएँ:
- अन्य बातें समान रहें (Ceteris Paribus): यह मान्यता है कि किसी एक चर के प्रभाव का अध्ययन करते समय अन्य सभी कारकों को स्थिर रखा जाता है।
- आर्थिक इकाई की विवेकशीलता (Rationality of the Economic Unit): यह माना जाता है कि उपभोक्ता और उत्पादक तर्कसंगत व्यवहार करते हैं, अर्थात उपभोक्ता अधिकतम संतुष्टि चाहता है और उत्पादक अधिकतम लाभ।
Two Assumptions of Economic Analysis:
- Other Things Remains the Same (Ceteris Paribus): This assumption states that while studying the effect of one variable, all other factors are kept constant.
- Rationality of the Economic Unit: It is assumed that consumers and producers behave rationally, i.e., consumers seek maximum satisfaction and producers seek maximum profit.
Q 2. तटस्थता मानचित्र बनाइये।
Draw an Indifference Map. [2 Marks]
तटस्थता मानचित्र (Indifference Map): तटस्थता मानचित्र विभिन्न तटस्थता वक्रों का एक समूह है, जो उपभोक्ता की प्राथमिकताओं को दर्शाता है। प्रत्येक वक्र संतुष्टि के एक विशिष्ट स्तर को प्रदर्शित करता है।
चित्र:
Y
↑
|   IC₄
|   IC₃
|   IC₂
|   IC₁
|_________________→
O                 X
व्याख्या: IC₁, IC₂, IC₃, IC₄ विभिन्न तटस्थता वक्र हैं। उच्च वक्र (जैसे IC₄) निम्न वक्र (जैसे IC₁) की तुलना में अधिक संतुष्टि दर्शाता है।
Q 3. एकाधिकारात्मक प्रतियोगिता को परिभाषित कीजिये।
Define the Monopolistic Competition. [2 Marks]
प्रो. चैम्बरलिन के अनुसार: "एकाधिकारात्मक प्रतियोगिता की धारणा अर्थशास्त्र की परम्परागत विचारधारा है और व्यक्तिगत कीमतों की या तो प्रतियोगिता के अन्तर्गत या एकाधिकार के अन्तर्गत व्याख्या की जाती है। परन्तु इसके विपरीत मेरे विचार में अधिकांश आर्थिक अवस्थाएँ प्रतियोगिता और एकाधिकार का मिश्रण होती हैं।"
परिभाषा: एकाधिकारात्मक प्रतियोगिता बाजार का वह रूप है जिसमें एक वस्तु के अनेक उत्पादक होते हैं जो निकट स्थानापन्न वस्तुओं का उत्पादन करते हैं, और बाजार में फर्मों का प्रवेश एवं निकास स्वतंत्र होता है।
Definition: Monopolistic Competition Market refers to that Market form, in which there are many producers of a Commodity which produces Close Substitute Goods and there is Free Entrance and Exit of Firms in the Market.
Q 4. सकल घरेलू उत्पाद क्या है ? बाजार कीमत पर सकल घरेलू उत्पाद की गणना का सूत्र लिखिये।
What is Gross Domestic Product (GDP) ? Write the Formula to Calculate Gross Domestic Product at Market Price. [2 Marks]
उत्तर: एक देश की घरेलू सीमा के अन्तर्गत एक वर्ष में उत्पादित समस्त अंतिम वस्तुओं व सेवाओं के बाजार मूल्यों के योग को सकल घरेलू उत्पाद कहा जाता है।
Gross Domestic Product at Market Price is the Sum of Market Value of all Final Goods and Services produced inside the Domestic Territory of a Country by all the Producers, during an Accounting Year.
सूत्र (Formula):
GDPMP = C + I + G + (X – M)
यहाँ,
- GDPMP = बाजार कीमत पर सकल घरेलू उत्पाद (Gross Domestic Product at Market Price)
- C = उपभोग व्यय (Consumption Expenditure)
- I = सकल निजी घरेलू निवेश (Investment Expenditure)
- G = सरकार द्वारा उत्पादित अथवा खरीदी गई वस्तुएँ व सेवाएँ (Government Expenditure)
- (X – M) = शुद्ध निर्यात (Net Exports) = निर्यात – आयात
Q 5. आय की विधि में, राष्ट्रीय आय की गणना में आने वाली दो कठिनाइयाँ बताइये।
In your View, Mention any Two Difficulties in the Measurement of National Income. [2 Marks]
उत्तर: आय की विधि में, राष्ट्रीय आय की गणना में आने वाली दो कठिनाइयाँ निम्नलिखित हैं:
- स्वयं के रोजगार से प्राप्त आय की गणना कठिन कार्य है। (It is very Difficult to Calculate Income from Self Employment.)
- पुरानी, अन्तरिम व मध्यवर्ती वस्तुओं के मूल्यांकन की कठिनाइयाँ। (Problem related to the Evaluation of Old, Interim and Intermediate Goods.)
Q 6. समग्र माँग से आप क्या समझते हैं ?
What do you understand by Aggregate Demand? [2 Marks]
उत्तर: एक दिए हुए आय व रोजगार के स्तर पर एक साल में अर्थव्यवस्था में जो वस्तुओं और सेवाओं की माँग की जाती है, उसे समग्र माँग कहते हैं। समग्र माँग एक अर्थव्यवस्था में समग्र खर्चे के बराबर होती है।
समग्र माँग = C + I + G + NE
जहाँ, C = उपभोग व्यय, I = निवेश व्यय, G = सरकारी व्यय, NE = शुद्ध निर्यात।
प्रश्न 7. घाटे का बजट से क्या अभिप्राय है ? समझाइये।
What is meant by Deficit Budget ? Explain. [2 Marks]
हल: जब सरकार की बजट प्राप्तियाँ बजट भुगतान से कम होती हैं, तब उसे घाटे का बजट कहा जाता है।
Solution: Budget Deficit refers to a situation when the Budget Expenditures of the Government are greater than the Budget Receipts.
प्रश्न 8. नकद रहित लेन-देन के किन्हीं दो माध्यमों का उल्लेख कीजिये।
Mention any TWO Modes of Cashless Transactions. [2 Marks]
हल: नकद रहित लेन-देन के दो माध्यम हैं:
- इंटरनेट बैंकिंग (Internet Banking)
- मोबाइल एप (Mobile App)
Solution: Two modes of cashless transactions are:
- Internet Banking
- Mobile App
SECTION – C (खण्ड – C)
19. तटस्थता वक्र की किन्हीं दो विशेषताओं को रेखाचित्रों की सहायता से समझाइये।
Explain any TWO Features of Indifference Curve with the help of Diagrams.
[4 Marks]
(i) तटस्थता वक्र का ढाल ऋणात्मक होता है (Negative Slope):
तटस्थता वक्र बाएं से दाएं नीचे की ओर झुके होते हैं। यदि उपभोक्ता को समान संतुष्टि के स्तर पर रहना है, तो किसी एक वस्तु की मात्रा को घटाने पर ही वह अन्य वस्तु के उपभोग को बढ़ा सकता है। तटस्थता वक्र न तो क्षैतिज सरल रेखा, न ही लम्बवत् सरल रेखा और न ही धनात्मक ढाल वाले होते हैं।
चित्र:
Units of Y
  |
  |   A (OX₁, OY₁)
  |    \
  |     \
  |      B (OX₂, OY₂)
  |       \
  |        \
  |         IC
  |
  +------------------→ Units of X
  O    X₁    X₂
चित्र में A बिन्दु OX₁ - X वस्तु की मात्रा व OY₁ - Y वस्तु की मात्रा के संयोग को बताता है जबकि B बिन्दु OX₂ - X वस्तु की मात्रा व OY₂ - Y वस्तु की मात्रा के संयोग को बताता है। यदि A बिन्दु से सूचित बंडल को B बिन्दु से सूचित बंडल की तुलना करें तो हम पाएंगे कि B बिन्दु के उपलब्ध होने पर उपभोक्ता B बिन्दु द्वारा दिखाये गये बंडल का चयन करेगा, क्योंकि यहां उसे X वस्तु की मात्रा A बिन्दु द्वारा दिखाये गये बंडल से ज्यादा मिलती है।
(ii) तटस्थता वक्र मूल बिन्दु के उन्नतोदर (Convex to Origin) होते हैं:
तटस्थता वक्र की यह विशेषता, सीमांत प्रतिस्थापन की ह्रासमान दर (Diminishing Marginal Rate of Substitution) के कारण होती है।
चित्र:
Commodity Y | | A | |\ | | \ | | \ | | \ | | \ | | \ | | \ | | \ | | \ | | \ | | \ | | \ | | \ | | \ | | \ | | \ | | \ | | \ | | \ | | \ | | \ | | \ | | \ | | \ | | \ | | \ | | \ | | \ | | \ | | \ | | \ | | \ | | \ | | \ | | \ | | \ | | \ | | \ | | \ | | \ | | \ | | \ | | \ | | \ | | \ | | \ | | \ | | \ | | \ | | \ | | \ | | \ | | \ | | \ | | \ | | \ | | \ | | \ | | \ | | \ | | \ | | \ | | \ | | \ | | \ | | \ | | \ | | \ | | \ | | \ | | \ | | \ | | \ | | \ | | \ | | \ | | \ | | \ | | \ | | \ | | \ | | \ | | \ | | \ | | \ | | \ | | \ | | \ | | \ | | \ | | \ | | \ | | \ | | \ | | \ | | \ | | \ | | \ | | \ | | \ | | \ | | \ | | \ | | \ | | \ | | \ | | \ | | \ | | \ | | \ | | \ | | \ | | \ | | \ | | \ | | \ | | \ | | \ | | \ | | \ | | \ | | \ | | \ | | \ | | \ | | \ | | \ | | \ | | \ | | \ | | \ | | \ | | \ | | \ | | \ | | \ | | \ | | \ | | \ | | \ | | \ | | \ | | \ | | \ | | \ | | \ | | \ | | \ | | \ | | \ | | \ | | \ | | \ | | \ | | \ | | \ | | \ | | \ | | \ | | \ | | \ | | \ | | \ | | \ | | \ | | \ | | \ | | \ | | \ | | \ | | \ | | \ | | \ | | \ | | \ | | \ | | \ | | \ | | \ | | \ | | \ | | \ | | \ | | \ | | \ | | \ | | \ | | \ | | \ | | \ | | \ | | \ | | \ | | \ | | \ | | \ | | \ | | \ | | \ | | \ | | \ | | \ | | \ | | \ | | \ | | \ | | \ | | \ | | \ | | \ | | \ | | \ | | \ | | \ | | \ | | \ | | \ | | \ | | \ | | \ | | \ | | \ | | \ | | \ | | \ | | \ | | \ | | \ | | \ | | \ | | \ | | \ | | \ | | \ | | \ | | \ | | \ | | \ | | \ | | \ | | \ | | \ | | \ | | \ | | \ | | \ | | \ | | \ | | \ | | \ | | \ | | \ | | \ | | \ | | \ | | \ | | \ | | \ | | \ | | \ | | \ | | \ | | \ | | \ | | \ | | \ | | \ | | \ | | \ | | \ | | \ | | \ | | \ | | \ | | \ | | \ | | \ | | \ | | \ | | \ | | \ | | \ | | \ | | \ | | \ | | \ | | \ | | \ | | \ | | \ | | \ | | \ | | \ | | \ | | \ | | \ | | \ | | \ | | \ | | \ | | \ | | \ | | \ | | \ | | \ | | \ | | \ | | \ | | \ | | \ | | \ | | \ | | \ | | \ | | \ | | \ | | \ | | \ | | \ | | \ | | \ | | \ | | \ | | \ | | \ | | \ | | \ | | \ | | \ | | \ | | \ | | \ | | \ | | \ | | \ | | \ | | \ | | \ | | \ | | \ | | \ | | \ | | \ | | \ | | \ | | \ | | \ | | \ | | \ | | \ | | \ | | \ | | \ | | \ | | \ | | \ | | \ | | \ | | \ | | \ | | \ | | \ | | \ | | \ | | \ | | \ | | \ | | \ | | \ | | \ | | \ | | \ | | \ | | \ | | \ | | \ | | \ | | \ | | \ | | \ | | \ | | \ | | \ | | \ | | \ | | \ | | \ | | \ | | \ | | \ | | \ | | \ | | \ | | \ | | \ | | \ | | \ | | \ | | \ | | \ | | \ | | \ | | \ | | \ | | \ | | \ | | \ | | \ | | \ | | \ | | \ | | \ | | \ | | \ | | \ | | \ | |Indifference Curves are Negative Sloping
Indifference curves always slope downwards to the right or have a negative slope. This is because if a consumer increases the units of one commodity, to maintain the same level of satisfaction, the consumer has to decrease the units of another commodity. So, as the units of X are increased, the units of Y have to be decreased, and vice-versa. Due to this negative relationship, indifference curves are downward sloping. As in the present diagram, as the consumer moves from A to B, the combination changes from OX + OY to OX₁ + OY₁. While moving from A to B, units of X are increased and units of Y are decreased.
Diagram: Downward Sloping Indifference Curve
Y
↑
|
| A (x, y)
| |
| |
| B (x₁, y₁)
| |
| |
| IC
|_________________→ X
0 x x₁Units of Y (y, y₁) decrease as Units of X (x, x₁) increase.
The slope of an indifference curve will never be horizontal, vertical, or upward sloping because in all these three cases, the basic feature of an indifference curve—i.e., the same level of satisfaction is derived at different points along the same indifference curve—is neglected.
Indifference Curves are Convex towards the Origin
Indifference curves are convex towards the origin because the marginal rate of substitution (MRS) continuously decreases. As the stock of one commodity decreases, its marginal importance for the consumer continuously increases, and as the stock of another commodity increases, its marginal importance for the consumer continuously decreases. Therefore, the consumer is ready to sacrifice lesser and lesser units of one commodity for every extra unit of another commodity to maintain the same level of satisfaction.
Diagram: Convex Indifference Curve
Y
↑
| P
| |
| | Q
| | |
| | R
| | |
| | S
| | |
| | D
| | |
| | IC
|_________________→ X
0 1 2 3 4Commodity X
As shown in the diagram, when the consumer increases one unit of X commodity, he decreases Y commodity equal to PQ, whereas for the next unit of X commodity, he decreases Y commodity equal to QR. As we can see that PQ > QR, it represents that MRS is decreasing, and due to that, the indifference curve becomes convex towards the origin.
20. निम्नलिखित समंकों से औसत आगम एवं सीमान्त आगम का आकलन कीजिये :
Calculate : Average Revenue and Marginal Revenue from the following given data :
Total Sales (In Units)
कुल बिक्री (इकाई में)1 2 3 4 Total Revenue (₹)
कुल आगम (रूपये में)20 36 48 56 Solution / हल:
Average Revenue (AR) / औसत आगम: AR = Total Revenue ÷ Units Sold
- Unit 1: 20 ÷ 1 = 20
- Unit 2: 36 ÷ 2 = 18
- Unit 3: 48 ÷ 3 = 16
- Unit 4: 56 ÷ 4 = 14
Marginal Revenue (MR) / सीमान्त आगम: MR = Change in Total Revenue ÷ Change in Units
- Unit 1: 20 - 0 = 20
- Unit 2: 36 - 20 = 16
- Unit 3: 48 - 36 = 12
- Unit 4: 56 - 48 = 8
Units 1 2 3 4 AR (₹) 20 18 16 14 MR (₹) 20 16 12 8
21. पूर्ण प्रतियोगिता बाजार से क्या अभिप्राय है ? पूर्ण प्रतियोगी बाजार में फर्म का औसत आगम वक्र बनाइये।
What is meant by Perfect Competitive Market ? Draw an Average Revenue (AR) Curve in Perfect Competitive Market.
[4 Marks]
Solution / हल:
पूर्ण प्रतियोगिता बाजार का अर्थ: बाजार का वह स्वरूप जिसमें क्रेताओं व विक्रेताओं की अत्याधिक संख्या होने के कारण वस्तु विशेष की कीमत को कोई भी फर्म प्रभावित नहीं कर सकती है। पूर्ण प्रतियोगिता बाजार में वस्तु की कीमत का निर्धारण उद्योग द्वारा दी पूर्ति तथा माँग के साम्य द्वारा होता है। एक फर्म वस्तु की कीमत को प्रभावित नहीं कर सकती क्योंकि उसका कुल उत्पादन में योगदान अत्यन्त सूक्ष्म या नगण्य होता है।
Meaning of Perfect Competitive Market: The form of market in which there are innumerable (large number) buyers and sellers of a commodity, producing homogenous goods and there is free entrance and exit of firms in the market, is known as Perfect Competition Market.
पूर्ण प्रतियोगी बाजार में फर्म का औसत आगम वक्र (AR Curve in Perfect Competition):
पूर्ण प्रतियोगिता में फर्म एक मूल्य-स्वीकारक (price taker) होती है, इसलिए उसका औसत आगम वक्र (AR) पूर्णतः लोचदार (perfectly elastic) होता है, जो कि कीमत रेखा के समानांतर एक क्षैतिज सीधी रेखा होती है।
AR Curve in Perfect Competition
Y ^ | Price = AR = MR | ____________________ (AR = MR) | | | | | | | | +-----------------------> X O OutputNote: AR curve is a horizontal straight line parallel to the X-axis at the level of market price.
Output (Units) Price (₹) TR (₹) AR (₹) MR (₹) 1 40 40 40 40 2 40 80 40 40 3 40 120 40 40 4 40 160 40 40 In perfect competition, AR = MR = Price (constant).
प्रश्न 22. बाजार संतुलन की अवधारणा को एक काल्पनिक तालिका की सहायता से संक्षेप में समझाइये।
Explain Briefly the Concept of Market Equilibrium with the help of Imaginary Table. [4 Marks]
उत्तर: संतुलन को एक ऐसी स्थिति के रूप में परिभाषित किया जाता है जहाँ बाजार में सभी उपभोक्ताओं तथा विक्रेताओं की योजनाएँ सुमेलित हो जाती हैं। संतुलन की स्थिति में जिस कुल मात्रा का विक्रय करने की सभी फर्म इच्छुक हैं, वह उस मात्रा के बराबर होता है जिसे बाजार में सभी उपभोक्ता खरीदने के इच्छुक हैं, अर्थात् बाजार पूर्ति, बाजार माँग के बराबर होती है।
जिस कीमत पर संतुलन होता है, उसे संतुलन कीमत कहते हैं। यदि किसी कीमत पर बाजार पूर्ति बाजार माँग से अधिक है तो उस कीमत पर बाजार में अधिपूर्ति या पूर्ति आधिक्य कहलाएगा। तथा यदि उस कीमत पर बाजार माँग, बाजार पूर्ति से अधिक है तो वहाँ उस कीमत पर बाजार में अधिमाँग या माँग आधिक्य कहलाएगा। (पूर्ण प्रतियोगिता में शून्य अधिमांग तथा शून्य अधिपूर्ति की स्थिति दिखाई देती है।)
काल्पनिक तालिका:
कीमत (₹) बाजार माँग (इकाइयाँ) बाजार पूर्ति (इकाइयाँ) अधिमाँग/अधिपूर्ति 10 100 40 अधिमाँग = 60 20 80 60 अधिमाँग = 20 30 60 60 संतुलन (शून्य) 40 40 80 अधिपूर्ति = 40 50 20 100 अधिपूर्ति = 80 व्याख्या: उपरोक्त तालिका में, जब कीमत ₹30 है, तो बाजार माँग (60 इकाइयाँ) और बाजार पूर्ति (60 इकाइयाँ) बराबर हैं। यह संतुलन की स्थिति है। ₹10 और ₹20 पर अधिमाँग है, जबकि ₹40 और ₹50 पर अधिपूर्ति है। पूर्ण प्रतियोगिता बाजार में, संतुलन कीमत बाजार माँग और बाजार पूर्ति की तुलनात्मक शक्ति द्वारा निर्धारित होती है।
प्रश्न 23. राष्ट्रीय आय की कोई चार विशेषताओं का वर्णन कीजिये।
Describe any FOUR Features of National Income. [4 Marks]
उत्तर: राष्ट्रीय आय की विशेषताएं निम्न प्रकार से हैं:
- एक देश की अर्थव्यवस्था से संबंध: राष्ट्रीय आय का संबंध एक देश की अर्थव्यवस्था से होता है। यह किसी एक क्षेत्र या राज्य की नहीं, बल्कि पूरे देश की आर्थिक गतिविधियों का माप है।
- निश्चित अवधि से संबंध: राष्ट्रीय आय का संबंध एक निश्चित अवधि से होता है, जो सामान्यतः एक वित्तीय वर्ष की होती है (भारत में 1 अप्रैल से अगले वर्ष के 31 मार्च तक)। यह एक वर्ष में उत्पादित सभी वस्तुओं और सेवाओं के मूल्य को दर्शाती है।
- निवासियों की आर्थिक क्रियाओं से संबंध: राष्ट्रीय आय का संबंध एक देश के निवासियों की आर्थिक क्रियाओं से होता है। वर्तमान में देश के भौगोलिक क्षेत्र में निवासियों और गैर-निवासियों की आर्थिक क्रियाओं का अध्ययन भी इसमें शामिल होता है।
- वस्तुओं और सेवाओं का शुद्ध मूल्य: राष्ट्रीय आय में केवल अंतिम वस्तुओं और सेवाओं का मूल्य शामिल किया जाता है, न कि मध्यवर्ती वस्तुओं का। यह दोहरी गणना से बचने में मदद करता है और अर्थव्यवस्था के वास्तविक उत्पादन को दर्शाता है।
Q24. मुद्रा के किन्हीं चार कार्यो को समझाइये।
Explain any FOUR Functions of Money. [4 Marks]
मुद्रा के कार्य:
मुद्रा के मुख्य कार्य:
- विनिमय का माध्यम: आधुनिक युग में मनुष्य का संपूर्ण जीवन विनिमय पर आधारित है तथा मुद्रा विनिमय के माध्यम का कार्य करती है। आज वस्तुओं व सेवाओं का क्रय-विक्रय मुद्रा के द्वारा किया जाता है।
- मूल्य मापक: मुद्रा समाज द्वारा उत्पन्न सभी वस्तुओं एवं सेवाओं के मूल्य मापक का कार्य करती है। जिस प्रकार लम्बाई को मीटर में, वजन को किलोग्राम में तथा तरल वस्तुओं को लीटर में मापा जाता है, ठीक उसी प्रकार वस्तुओं और सेवाओं के मूल्य को मुद्रा में मापा जाता है। मुद्रा का मूल्य मापक कार्य हिसाब या लेखे की इकाई (Unit of Account) भी कहलाती है।
- स्थगित (भावी) भुगतानों का मान: मुद्रा केवल वर्तमान भुगतानों के मान का कार्य ही नहीं करती बल्कि मुद्रा ऐसे भुगतानों के लिए भी उचित आधार है जो तत्काल न करके भविष्य में किये जायेंगे। आज का युग साख युग है जिसमें अधिकांश व्यापारिक सौदे साख पर चलते हैं। यह साख या उधार मुद्रा के रूप में ही दी जाती है।
- मूल्य संचय का साधन: मुद्रा का दूसरा गौण कार्य मूल्य का संचय करना है। कोई भी व्यक्ति अपनी आय में से बचत कर सकता है तथा इस बचत को मुद्रा के रूप में सुरक्षित रख सकता है। मुद्रा में क्रय शक्ति होती है जिसे संचित करके रखा जाता है।
Functions of Money:
Primary Functions:
- Medium of Exchange: Money serves as a medium of exchange and facilitates the buying and selling of goods, thereby eliminating the need for double coincidence of needs and wants as under barter.
- Measure of Value: Money has also removed the difficulty of barter system by serving as a common measure of value. The values of various commodities are expressed in terms of money. Money as a measure of value has made transactions simple and easy.
- Standard of Deferred Payments: Money has always been used as a standard of deferred payment. This function of money has attained more importance in modern times with the growth of credit transactions.
- Store of Value: Money acts as a store of value, allowing individuals to save their income and preserve purchasing power for future use. It is a convenient way to store wealth.
Solution: The four primary functions of money are:
- Medium of Exchange: Money is used to buy and sell goods and services, replacing the barter system.
- Measure of Value: Money provides a common unit to measure and compare the value of different goods and services.
- Standard of Deferred Payments: Money facilitates future payments and credit transactions, as it is accepted for payments made at a later date.
- Store of Value: Money allows individuals to save and store wealth for future use, as it retains its purchasing power over time.
प्रश्न 25. व्यापार विस्तार का आधार साख (क्रेडिट) है। इस क्रिया के परिणामस्वरूप भविष्य के भुगतानों को मुद्रा के रूप में व्यक्त करना संभव हो गया है।
- मूल्य का संचय (Store of Value): शास्त्रीय अर्थशास्त्रियों ने मुद्रा के मूल्य संचय कार्य को मान्यता नहीं दी। कीन्स ने मुद्रा के इस कार्य पर बल दिया। लोग अप्रत्याशित आपात स्थितियों से निपटने के लिए मुद्रा का संचय करते हैं।
व्यापक आर्थिक साम्य को रेखाचित्र की सहायता से समझाइये।
Explain Macro Economic Equilibrium with the help of a Diagram. [4 Marks]
व्याख्या: व्यापक आर्थिक साम्य (Macro Economic Equilibrium) वह स्थिति है जहाँ समग्र मांग (AD) और अल्पकालीन समग्र पूर्ति (SAS) बराबर होती है। यह AD-AS मॉडल द्वारा अल्पकालीन संतुलन अर्थव्यवस्था की वास्तविक स्थिति को बताता है। मौद्रिक एवं राजकोषीय नीति किस प्रकार कारगर सिद्ध होती है, यह AD-AS मॉडल द्वारा बताया गया है।
रेखाचित्र (Diagram):
कीमत स्तर (Price Level) ^ | SAS (अल्पकालीन पूर्ति) | / | / E (साम्य बिंदु) | / | |/ | AD (समग्र मांग) +-------------------> वास्तविक सकल घरेलु उत्पाद (Real GDP) 0 Y* (साम्य उत्पादन)व्याख्या:
- समग्र मांग (AD) और अल्पकालीन पूर्ति (SAS) के बराबर होने पर साम्य (Equilibrium) होता है।
- यदि कीमत P₀ होती है तो समग्र पूर्ति, समग्र मांग से अधिक होती है। ऐसी स्थिति में उत्पादक उत्पादन में कमी करता है। मांग कम होने पर वह उत्पादित माल को बेच नहीं पाता है। कीमत क्रमशः कम होने लगती है और पुनः P₀ साम्य कीमत को प्राप्त करती है।
- इसके विपरीत यदि कीमतें OP₁ होती है तो समग्र मांग समग्र पूर्ति की अपेक्षाकृत अधिक होती है (AB), जिसे अधिक मांग कहा जाता है। अधिक मांग उत्पादक को अधिक उत्पादन के लिए प्रेरित करती है। उत्पादक द्वारा उत्पादन साधनों की मांग बढ़ने पर साधन लागत में वृद्धि होती है। वस्तुओं की कीमत बढ़ने लगती है और पुनः साम्य P₀ कीमतों पर स्थापित होता है।
- दीर्घकाल में साम्य तब होता है जब समग्र मांग, दीर्घकालीन समग्र पूर्ति (LAS) के बराबर होता है। दीर्घकालीन पूर्ति वक्र GDP लम्बवत् होने पर सामर्थ्य GDP के बराबर होता है। दीर्घकाल में वास्तविक GDP, सामर्थ्य GDP के बराबर होती है।
Short Term Equilibrium tells the Actual Condition of the Economy. Actual GDP remains close to Potential GDP. The Aggregate Demand (AD) – Aggregate Supply (AS) Model informs as to how are the Monetary and Fiscal Policies become Effective.
Q 26.
When the Aggregate Demand (AD) is equal to the Short Run Aggregate Supply Curve (SRAS), the equilibrium is at E, where income OY₀ and price level OP₀ are determined. If the price is OP₂, the aggregate supply is comparatively more than aggregate demand, which is called Minimum Demand (CD). In such a situation, the producer cuts down production. As demand is less, the produced goods cannot be sold and these goods are stored as stock. Costs begin to go down and again attain the equilibrium price OP₀.
Opposed to this, if the price is OP₁, then the aggregate demand is comparatively more than aggregate supply, which is called Predominant Demand (AB). More demand encourages more production. As producers demand more means of production, it leads to an increment in investment. Finally, the price of goods begins to increase and equilibrium OP₀ is again attained in the prices. In the short term, the monetary wage level is stable and actual GDP may be more or less than potential GDP. In the long term, equilibrium is attained when aggregate demand is equal to the long term aggregate supply curve. The long term supply curve GDP is vertical and so is equal to potential GDP. In the long term, actual GDP is equal to potential GDP.
Explanation: This describes the short-run and long-run equilibrium in the AD-AS model. In the short run, price and output adjust to balance AD and SRAS. In the long run, the economy returns to potential GDP (vertical LRAS) with flexible wages and prices.
Q 27.
यदि सीमान्त उपभोग प्रवत्ति 0.8 है, तो निवेश गुणांक का मान ज्ञात कीजिये।
If the Marginal Propensity to Consume (MPC) is 0.8, Calculate the Value of Investment Multiplier. [4 Marks]Solution:
Investment Multiplier (k) = 1 / (1 - MPC)
Given MPC = 0.8
k = 1 / (1 - 0.8) = 1 / 0.2 = 5
Answer: The value of the investment multiplier is 5.
आपकी दष्टि से, बजट के कोई चार उद्देश्य बताइये।
In your view, state any FOUR Objectives of Budget. [4 Marks]
Solution:
Budget is a tool through which all methods of financial administration are related, compared, and coordinated. It presents the government's expected income and unexpected expenditure before the parliament, and after parliament's approval, work is done according to its proposals. The main objectives of the budget are:
- To influence not only development but also the direction of development.
- To increase production through tax relief, concessions, and duty relief incentives.
- To control the price level by imposing new taxes and borrowing from the public, thereby reducing purchasing power.
- To accelerate the economic and social development of the country and redistribute income and wealth.
In English: The objective of the budget is to provide direction to the economy of the country. The country's economic setup is directly affected by the government. The main objectives of a budget are:
- Besides affecting the growth and development of a country, the budget also provides direction to it.
- To increase production through tax relief and duty relief incentives.
- To control price levels by reducing purchasing power through taxes and borrowing.
- To redistribute income and wealth and accelerate economic and social development.
SECTION-D (खण्ड - D)
माँग के दो तत्व बताइये। माँग के नियम की व्याख्या रेखाचित्र की सहायता से कीजिये।
State TWO Elements of Demand. Explain the Law of Demand with the help of a Diagram.
OR
माँग की कीमत लोच किसे कहते हैं? माँग की कीमत लोच की किन्हीं दो श्रेणियों को रेखाचित्रों की सहायता से समझाइये।
What is the Price Elasticity of Demand? Explain any TWO Types of Price Elasticity of Demand with the help of Diagrams.
[6 Marks]
माँग में निम्न तत्व सम्मिलित होते हैं:
- किसी वस्तु की इच्छा या आवश्यकता
- इस वस्तु को खरीदने के लिए मुद्रा या पैसा
माँग के नियम की व्याख्या
माँग का नियम वस्तु के मूल्य और माँग के सम्बन्ध को स्पष्ट करता है। माँग वस्तु के मूल्य में वृद्धि होने पर उसकी मात्रा कम क्रय की जाती है और मूल्य में कमी होने पर उसकी मात्रा अधिक क्रय की जाती है। माँग और मूल्य के इस विपरीत सम्बन्ध को ही माँग के नियम द्वारा स्पष्ट किया गया है। इस नियम को निम्न प्रकार परिभाषित किया गया है: प्रो. मार्शल के शब्दों में, "कीमत में कमी होने पर माँग की मात्रा में वृद्धि तथा कीमत में वृद्धि होने पर माँग की मात्रा में कमी होती है।"
Solution / उत्तर
Elements of Demand (माँग के तत्व):
- Desire or need for a commodity (किसी वस्तु की इच्छा या आवश्यकता)
- Money or purchasing power to buy the commodity (इस वस्तु को खरीदने के लिए मुद्रा या पैसा)
Law of Demand (माँग का नियम):
The Law of Demand states that, other things being equal, as the price of a good increases, the quantity demanded decreases, and as the price decreases, the quantity demanded increases. This inverse relationship between price and quantity demanded is the core of the law. According to Prof. Marshall, "When the price falls, the quantity demanded rises, and when the price rises, the quantity demanded falls."
Diagram (रेखाचित्र):
(A diagram would show a downward-sloping demand curve with Price on the Y-axis and Quantity on the X-axis. Points at price 250 and quantity 500 are indicated, showing the inverse relationship.)
In the diagram, as price decreases from a higher level to 250, quantity demanded increases to 500, illustrating the law of demand.
माँग की कीमत लोच (Price Elasticity of Demand)
माँग की कीमत लोच वह माप है जो यह बताती है कि किसी वस्तु की कीमत में परिवर्तन होने पर उसकी माँग की मात्रा में कितना परिवर्तन होता है। इसे निम्न सूत्र द्वारा मापा जाता है:
Price Elasticity of Demand (Ed) = (% Change in Quantity Demanded) / (% Change in Price)
Solution / उत्तर (दो श्रेणियाँ)
Two Types of Price Elasticity of Demand (माँग की कीमत लोच की दो श्रेणियाँ):
1. Perfectly Elastic Demand (पूर्णतः लोचदार माँग):
When a small change in price leads to an infinite change in quantity demanded, demand is perfectly elastic. In this case, the demand curve is a horizontal straight line parallel to the X-axis. The elasticity coefficient (Ed) is infinity (∞).
(Diagram: A horizontal line parallel to the quantity axis, showing that at a given price, any quantity is demanded.)
2. Perfectly Inelastic Demand (पूर्णतः बेलोचदार माँग):
When the quantity demanded does not change at all with a change in price, demand is perfectly inelastic. The demand curve is a vertical straight line parallel to the Y-axis. The elasticity coefficient (Ed) is zero (0).
(Diagram: A vertical line parallel to the price axis, showing that quantity demanded remains constant regardless of price changes.)
Other types (for reference): Unitary Elastic (Ed = 1), Relatively Elastic (Ed > 1), Relatively Inelastic (Ed < 1).
माँग का नियम एवं माँग की कीमत लोच
माँग का नियम (Law of Demand)
सरल शब्दों में हम कह सकते हैं कि माँग का नियम हमें यह बताता है कि अन्य बातें समान रहने पर वस्तु की कीमत में कमी आने पर उसकी अधिक मात्रा तथा कीमत में वृद्धि होने पर उसकी कम मात्रा खरीदी जाती है। संक्षेप में, यह कीमत और माँग में विपरीत संबंध बताता है।
माँग का नियम एक गुणात्मक कथन है, यह नियम माँग में होने वाले परिवर्तनों की दिशा की ओर संकेत करता है, इन परिवर्तनों की माप नहीं करता।
नियम की प्रमुख मान्यताएँ:
- उपभोक्ता की आय स्थिर रहनी चाहिए।
- उपभोक्ता की रुचि एवं आदत में कोई परिवर्तन नहीं होना चाहिए।
- सम्बन्धित वस्तुओं के मूल्य में कोई परिवर्तन नहीं होना चाहिए।
- किसी अन्य नई वस्तु का विकास नहीं होना चाहिए अथवा ग्राहक को उसका पता नहीं चलना चाहिए।
- वस्तु के मूल्य में और अधिक परिवर्तन की सम्भावना नहीं होनी चाहिए।
- वस्तु प्रतिष्ठाजनक नहीं होनी चाहिए।
अथवा (OR)
माँग की कीमत लोच (Price Elasticity of Demand)
माँग की कीमत लोच यह स्पष्ट करती है कि वस्तु के मूल्य में एक निश्चित परिवर्तन होने पर उसकी माँग में कितना परिवर्तन होगा। इस प्रकार, किसी वस्तु के मूल्य में एक निश्चित परिवर्तन होने पर उसकी माँग की मात्रा में जो आनुपातिक परिवर्तन होगा, उसकी माप ही माँग की कीमत लोच है।
श्रीमती रॉबिन्सन के अनुसार, "किसी कीमत पर माँग की लोच कीमत में थोड़े परिवर्तन के प्रत्युत्तर में क्रय की गई मात्रा के आनुपातिक परिवर्तन को कीमत के आनुपातिक परिवर्तन से भाग देने पर प्राप्त होती है।" सूत्र के रूप में इसे निम्न प्रकार व्यक्त किया जा सकता है:
माँग की लोच (Ed) = माँगी गई मात्रा में आनुपातिक/प्रतिशत/मात्रात्मक परिवर्तन / मूल्य में आनुपातिक/प्रतिशत/मात्रात्मक परिवर्तन
Ed = (ΔQ / Q) / (ΔP / P)
जहाँ, ΔQ = माँगी गई मात्रा में परिवर्तन, Q = प्रारंभिक मात्रा, ΔP = मूल्य में परिवर्तन, P = प्रारंभिक मूल्य
माँग की लोच की श्रेणियाँ:
किसी वस्तु के मूल्य में परिवर्तन हो जाने पर उसकी माँग में भी परिवर्तन हो जाता है परन्तु मूल्य में परिवर्तन का सभी वस्तुओं की माँग पर समान प्रभाव नहीं पड़ता। कुछ वस्तुओं की माँग अधिक लोचदार होती है जबकि कुछ वस्तुओं की माँग कम लोचदार होती है। इस आधार पर माँग की लोच को निम्न पाँच भागों में विभाजित किया गया है:
- पूर्णतया लोचदार माँग (Perfectly Elastic Demand) : जब किसी वस्तु की माँग उसके मूल्य में बिना किसी परिवर्तन के ही अथवा मूल्य में बहुत कम परिवर्तन होने पर स्वयं ही घटती-बढ़ती रहती है तो इसे पूर्णतया लोचदार माँग कहते हैं। यह एक काल्पनिक विचार है। वास्तविक जीवन में ऐसी कोई वस्तु नहीं है जिसकी माँग पूर्णतया लोचदार हो। इसके वक्र का आकार क्षैतिज अथवा अक्ष के समानान्तर होता है।
माँग की लोच (Elasticity of Demand)
(2) इकाई से अधिक लोचदार माँग (Highly Elastic Demand ed > 1)
जब किसी वस्तु के मूल्य में होने वाला परिवर्तन कम होता है और माँगी गई मात्रा में होने वाला परिवर्तन अधिक होता है तो इसे इकाई से अधिक लोचदार माँग कहते हैं। प्रायः विलासिता की वस्तुओं की माँग इकाई से अधिक लोचदार होती है।
इसे निम्न आकृति की सहायता से स्पष्ट किया जा सकता है:
Relatively Elastic Demand
(मूल्य में कम परिवर्तन, माँग में अधिक परिवर्तन)
Unit Elasticity of Demand
The Two Elements of Demand are:
- Willingness to Buy a Commodity
- Resources to Buy that Commodity
The Law of Demand:
In law of demand we study the impact on quantity demanded due to change in price of concerned commodity, when rest of the determinants remains constant.
According to law of demand, "More quantity is demanded due to fall in price and less quantity is demanded due to rise in price, when other things remains constant." Thus law of demand shows the negative relationship between price of a commodity and its quantity demanded. According to law of demand, demand of a commodity is a function of its price.
Dx = f (Px)
here, Dx = Demand of X commodity, Px = Price of X commodity
Law of demand is only a qualitative statement (because it only indicates the direction in which the demand will change, whether it rises or falls). Law of demand says that demand varies inversely with price, not necessarily proportionately.
Assumptions of Law of Demand
The phrase, "other things remains constant" used in law of demand, represents assumptions of law of demand. The law of demand would be applicable only if other things would remain the same, (ceteris paribus) means the determinants of demand other than price of the concerned commodity remains unchanged. The following are some important assumptions of law of demand:
- Price of other related goods remains constant.
- Income of the consumer remains unchanged.
- Psychological factors like habits, taste, preferences of the consumers remains constant.
- There is no expectation about the future price changes, etc.
Explanation of the Law
According to law of demand consumer demand less of the commodity when it becomes costlier and consumer demand more of the commodity when it becomes cheaper. In other words it shows the inverse relationship between price of concerned commodity and its quantity demanded. This inverse relationship can be seen in demand schedule and demand curve. The negative slope of the demand curve is due to the inverse relationship between price of the commodity and quantity demanded. When the price of commodity was OP the consumer was demanding OQ units of the commodity. As the price rises to OP1 the demand falls to OQ1 (which is contraction in demand) and as the price falls to OP2 the demand rises to OQ2 (which is expansion in demand).
Diagram Explanation:
In the demand curve diagram, price is measured on the Y-axis and quantity demanded on the X-axis. The demand curve slopes downward from left to right. At price OP, quantity demanded is OQ. When price rises to OP1, quantity demanded contracts to OQ1. When price falls to OP2, quantity demanded expands to OQ2.
OR
Price Elasticity of Demand
Price Elasticity of Demand measures the Degree of Responsiveness in Quantity Demanded due to Change in Price, when other factors remains Constant. It can be measured by the following methods:
A. Percentage Method
According to this method degree of elasticity of demand can be calculated by the ratio between percentage change in quantity demanded and percentage change in price of the commodity. For this, first we have to calculate the percentage change in price and percentage change in quantity demanded, which we can calculate by using the given formulae:
Formula:
Price Elasticity of Demand (Ed) = (Percentage Change in Quantity Demanded) / (Percentage Change in Price)
Where,
- Percentage Change in Quantity Demanded = (Change in Quantity / Original Quantity) × 100
- Percentage Change in Price = (Change in Price / Original Price) × 100
Price Elasticity of Demand – Calculation & Degrees
Steps to Calculate Price Elasticity of Demand
- Percentage Change in Price = \(\frac{\Delta P}{P} \times 100\)
- Percentage Change in Quantity Demanded = \(\frac{\Delta Q}{Q} \times 100\)
Where:
- ΔP = Change in Price
- ΔQ = Change in Quantity Demanded
- P = Initial Price
- Q = Initial Quantity Demanded
Then, the coefficient of price elasticity of demand (ep) is calculated as:
Formula:
ep = \(\frac{\% \text{ Change in Quantity Demanded}}{\% \text{ Change in Price}}\)Proportionate Method
According to this method, the coefficient of price elasticity of demand is calculated by the ratio between the proportionate change in quantity demanded and the proportionate change in price.
Formula:
ep = \(\frac{\text{Proportionate Change in Quantity Demanded}}{\text{Proportionate Change in Price}}\)
= \(\frac{\Delta Q / Q}{\Delta P / P}\) = \(\frac{\Delta Q}{\Delta P} \times \frac{P}{Q}\)Where:
- ΔQ = Change in Quantity Demanded
- ΔP = Change in Price
- Q = Initial Quantity Demanded
- P = Initial Price
Degrees of Price Elasticity of Demand
The degrees of price elasticity of demand can be classified as follows:
(a) Perfectly Elastic Demand
When the quantity demanded changes too much (increases to infinity or decreases to zero) with a very minute change in price, it is termed perfectly elastic demand. This condition is found in a perfect competition market where the commodity produced by different firms is identical (homogeneous). However, this condition does not exist in the practical world.
- Demand Curve: Horizontal or parallel to the X-axis.
- Slope of Demand Curve: Zero.
- Degree of Elasticity: Infinite (ep = ∞) because of the extreme change in quantity demanded.
Correct Answer: Perfectly Elastic Demand – ep = ∞29. Explain the Equilibrium of a Firm by Total Revenue (TR) and Total Cost (TC) Approach with the help of Diagram.
OR
Explain the Equilibrium of a Firm by Marginal Revenue (MR) and Marginal Cost (MC) Approach with the help of Diagram.
[6 Marks]
Solution:
Every firm aims to maximize its profit. A firm determines the level of output at which its profit is maximum. To achieve this objective, it adjusts its output level until it reaches equilibrium where maximum profit is earned. The difference between revenue and cost indicates profit or loss. If a firm's revenue exceeds its cost, it earns profit; conversely, if revenue is less than cost, it incurs a loss.
Total Revenue and Total Cost Approach
According to this approach, a firm is in equilibrium at the level of output where the difference between Total Revenue (TR) and Total Cost (TC) is maximum. In other words, the firm will be in equilibrium when the profit (TR - TC) is the highest.
Diagram Explanation:
In the diagram, the X-axis represents the quantity of output, and the Y-axis represents revenue and cost. The TR curve is upward sloping, indicating that total revenue increases with output. The TC curve initially rises slowly, then steeply. The vertical distance between TR and TC curves represents profit. At output levels OQ₁ and OQ₃, TR equals TC, so profit is zero (break-even points). The maximum vertical distance between TR and TC occurs at output level OQ₂, where the firm earns maximum profit. Thus, the firm is in equilibrium at output OQ₂.
Conditions for Equilibrium (TR-TC Approach):
- The difference between TR and TC must be maximum (i.e., profit is maximum).
- At the equilibrium output, the slope of TR curve should equal the slope of TC curve (i.e., MR = MC).
Marginal Revenue and Marginal Cost Approach
According to this approach, a firm is in equilibrium when the following two conditions are satisfied:
- Marginal Revenue (MR) = Marginal Cost (MC)
- MC must be rising after the point of equality (i.e., MC curve cuts MR curve from below)
Diagram Explanation:
In the diagram, the X-axis represents output, and the Y-axis represents revenue and cost. The MR curve is downward sloping (under imperfect competition) or horizontal (under perfect competition). The MC curve is U-shaped. The firm is in equilibrium at point E where MR = MC. At output levels before OQ, MR > MC, so profit increases by expanding output. After OQ, MR < MC, so profit decreases. At output OQ, MR = MC and MC is rising, ensuring maximum profit.
Conditions for Equilibrium (MR-MC Approach):
- MR = MC (necessary condition)
- MC must be rising at the point of intersection (sufficient condition)
लागत, लाभ
इस चित्र में x अक्ष पर उत्पादन मात्रा और y अक्ष पर कुल आगम, कुल लागत और लाभ की मात्रा दर्शायी गयी है।
व्याख्या:
- कुल आगम (TR) वक्र: शून्य से प्रारम्भ होता है, जिससे स्पष्ट है कि यदि उत्पादन शून्य है तो कुल आगम भी शून्य होता है। उत्पादन बढ़ने पर आगम वक्र दायें ऊपर की ओर उठता है।
- कुल लागत वक्र (TC): O बिन्दु से प्रारम्भ होता है एवं OC स्थिर लागत होती है। उत्पादन शून्य होने पर भी फर्म को OC के बराबर लागत वहन करनी पड़ती है।
- कुल लाभ (TP): कुल आगम और लागत के अन्तर से अर्जित होता है। इसे TR और TC वक्र के अन्तर से व्युत्पन्न किया गया है।
विभिन्न उत्पादन स्तरों पर स्थितियाँ:
- प्रारम्भिक उत्पादन स्तर (K से पहले): TC > TR होता है, अतः फर्म को हानि होती है। व्युत्पन्न लाभ वक्र (TP) ऋणात्मक क्षेत्र में स्थित है।
- M बिन्दु (समस्थिति बिन्दु): जब TR = TC होता है, तो फर्म को न लाभ होता है न हानि। कुल लाभ (TP) X-अक्ष पर स्पर्श करता है, अर्थात् K उत्पादन स्तर पर लाभ शून्य है।
- K और L बिन्दुओं के मध्य: TR > TC होता है, अतः लाभ धनात्मक है। TR वक्र TC वक्र से ऊपर है।
- E और F बिन्दु (अधिकतम लाभ): TR और TC वक्रों पर स्पर्श रेखाएँ जहाँ स्पर्श करती हैं, वहाँ TR और TC के मध्य दूरी अधिकतम होती है, इसलिए लाभ भी अधिकतम होते हैं। साम्य उत्पादन मात्रा OQ निर्धारित होती है। अधिकतम लाभ की मात्रा SQ होती है।
- KQ के मध्य उत्पादन: TR और TC के मध्य अन्तर बढ़ता हुआ होता है, अर्थात् कुल लाभ बढ़ती दर से प्राप्त होते हैं। Q बिन्दु पर अधिकतम होते हैं।
- QL उत्पादन पर: लाभ प्राप्त होते हैं किन्तु TR और TC का अन्तर कम होता जाता है, तो लाभ भी घटने लगते हैं। TP वक्र नीचे की ओर गिरता है।
- N बिन्दु (पुनः समस्थिति): TR = TC होता है, यह समस्थिति बिन्दु कहलाता है। यहाँ न लाभ और न हानि की स्थिति होती है।
Page 20
उत्पादन मात्रा के बाद यदि फर्म और अधिक उत्पादन करती है तो कुल लागत बढ़ती जाती है और कुल आगम घटता है (TC > TR)। फर्म को हानि होती है। कुल लाभ (TP) OX के नीचे होता है।
चित्र के आधार पर फर्म का संतुलन OQ उत्पादन मात्रा पर होता है, क्योंकि इस उत्पादन मात्रा पर कुल आगम (TR) और कुल लागत (TC) का अन्तर अधिकतम होता है। अर्थात् लाभ मात्रा SQ अधिकतम होती है।
आलोचना
- कुल आगम और कुल लागत के मध्य अधिकतम दूरी ज्ञात करना कठिन होता है। कई स्पर्श रेखाएँ खींचने पर वास्तविक बिन्दु प्राप्त होता है।
- चित्र के आधार पर प्रति इकाई कीमत को ज्ञात करना सम्भव नहीं होता क्योंकि कीमत को प्रत्यक्षतः नहीं दिखाया जाता है।
अथवा
सीमान्त आगम और सीमान्त लागत विधि
सीमान्त आगम का अर्थ है एक फर्म को एक अतिरिक्त इकाई के विक्रय करने पर जो अतिरिक्त आय प्राप्त होती है। इसी प्रकार सीमान्त लागत से तात्पर्य होता है कि फर्म को एक अतिरिक्त इकाई के उत्पादन पर जो अतिरिक्त व्यय करना पड़ता है। जब सीमान्त आगम (MR) के बराबर सीमान्त लागत (MC) हो तो वह फर्म की आदर्श उत्पादन मात्रा होती है, अर्थात् जब MC = MR होगा तब फर्म का लाभ अधिकतम होगा।
चित्र की व्याख्या
- X अक्ष पर उत्पादन मात्रा और Y अक्ष पर सीमान्त आगम (MR) और सीमान्त लागत (MC) दर्शायी गई है।
- MR सीमान्त आगम वक्र (MR) और MC सीमान्त लागत वक्र (MC) है।
- अपूर्ण प्रतियोगिता अथवा एकाधिकार बाजार में सीमान्त आगम वक्र नीचे गिरता हुआ होता है।
फर्म के संतुलन की शर्तें (Conditions of Firm's Equilibrium)
फर्म के संतुलन की प्रथम शर्त होती है कि सीमान्त आगम (MR), सीमान्त लागत (MC) के बराबर होती है। यह चित्र में बिन्दु E द्वारा दर्शाया गया है। उत्पादन मात्रा OQ पर लाभ अधिकतम होगा।
- यदि उत्पादन मात्रा OM होती है तब सीमान्त आगम (FM) सीमान्त लागत (GM) की तुलना में अधिक होता है। फर्म और अधिक लाभ प्राप्त करने के लिए उत्पादन में वृद्धि करती है।
- यदि उत्पादन का स्तर ON होता है, तब सीमान्त लागत (HN) सीमान्त आगम (IN) से अधिक होती है। इस स्थिति में फर्म को उत्पादन करने की हानि होती है।
इस प्रकार फर्म का संतुलन E बिन्दु पर होता है जहाँ MC = MR होता है, OQ उत्पादन मात्रा निर्धारित होती है जिस पर लाभ अधिकतम होते हैं। फर्म के संतुलन की दूसरी शर्त यह होती है कि MC वक्र MR वक्र को नीचे से काटना चाहिए (पूर्ण प्रतियोगिता में आवश्यक)।
चित्र की व्याख्या
- E बिन्दु पर सीमान्त आगम (MR) सीमान्त लागत (MC) के बराबर है। अर्थात MC = MR, पहली साम्य शर्त यहाँ पूरी होती है। दूसरी शर्त MC, MR वक्र को नीचे से काटना चाहिए भी पूरी होती है। इस तरह OQ उत्पादन मात्रा पर फर्म को अधिकतम लाभ अर्जित होते हैं। यह फर्म का संतुलन कहलाता है।
- यदि फर्म उत्पादन मात्रा OM निर्धारित करती है तो प्रथम शर्त (MC = MR) F बिन्दु पर पूर्ण होती है किन्तु दूसरी शर्त के अभाव में फर्म अधिकतम लाभ अर्जित नहीं कर सकती। F बिन्दु से पूर्व MC > MR हानि को दर्शाता है।
अतः फर्म का संतुलन OQ उत्पादन स्तर पर होता है जहाँ दोनों शर्तें पूर्ण होती हैं:
- MR = MC
- MC वक्र MR वक्र को नीचे से काटता है।
सीमान्त आगम-सीमान्त लागत विधि (MR-MC Approach): यह विधि श्रेष्ठ है क्योंकि सरलता से अधिकतम लाभ और उत्पादन मात्रा ज्ञात की जा सकती है। फर्म के औसत आगम और सीमान्त आगम वक्रों का उपयोग करने पर प्रति इकाई कीमत भी ज्ञात की जा सकती है।
According to this method, the Firm's Equilibrium will be in that condition when the Difference between the Revenue and Cost will be the Most i.e. the Difference between the TR and TC Curves is Maximum.
लागत, लाभ एवं कुल आगम
अपूर्ण प्रतिस्पर्धा एवं एकाधिकार बाजार (Imperfect and Monopoly Market):
ग्राफ में, x-अक्ष पर उत्पादन मात्रा (Output Quantity) तथा y-अक्ष पर कुल आगम (Total Revenue - TR), कुल लागत (Total Cost - TC) और लाभ की मात्रा (Quantity of Profit) को दर्शाया गया है। कुल आगम (TR) वक्र शून्य से प्रारंभ होता है। यदि उत्पादन मात्रा शून्य है, तो कुल आगम भी शून्य होगा। जैसे-जैसे उत्पादन बढ़ता है, कुल आगम बढ़ता है और आगम वक्र दाईं ओर ऊपर उठता है। कुल लागत (TC) वक्र बिंदु C से प्रारंभ होता है और OC स्थिर लागत (Fixed Cost) है। भले ही उत्पादन शून्य हो, फर्म को OC के बराबर व्यय वहन करना पड़ता है।
कुल आगम (TR) और कुल लागत (TC) के बीच का अंतर कुल लाभ (Total Profit - TP) देता है। TP वक्र TR और TC वक्र के बीच के अंतर से प्राप्त होता है।
- प्रारंभ में, उत्पादन स्तर 'K' पर TC > TR है, जिससे कुल लाभ (TP) वक्र ऋणात्मक क्षेत्र में स्थित होता है।
- बिंदु M पर, जब कुल आगम (TR) कुल लागत (TC) के बराबर होता है, तो फर्म को न तो लाभ होता है और न ही हानि। इस स्थिति को सम-विच्छेद बिंदु (Break Even Point) कहा जाता है, अर्थात बिंदु 'K' पर शून्य लाभ।
- जब उत्पादन बिंदु K और L के बीच होता है, तो कुल आगम कुल लागत से अधिक होता है। इस क्षेत्र में, TR वक्र TC वक्र के ऊपर होता है, अर्थात TR > TC, और कुल लाभ धनात्मक होता है।
- TR और TC के बीच अधिकतम अंतर ज्ञात करने के लिए स्पर्श रेखाएँ GH और IJ खींची जाती हैं। बिंदु E और F पर TR और TC वक्रों के बीच की दूरी सबसे अधिक होती है, जहाँ ये स्पर्श रेखाएँ कुल आगम और कुल लागत वक्रों को स्पर्श करती हैं।
- संतुलन उत्पादन मात्रा इस स्तर पर OQ है। इस प्रकार, अधिकतम लाभ की मात्रा SQ है।
उत्पादन KQ पर, TR और TC के बीच का अंतर बढ़ रहा है, अर्थात कुल लाभ बढ़ती दर पर हो रहा है और बिंदु S पर अधिकतम है। QL पर भी लाभ होता है, लेकिन TR और TC के बीच का अंतर कम होता जाता है और लाभ भी घटने लगता है। TP वक्र ढलान या नीचे गिरने लगता है। बिंदु N पर, कुल आगम (TR) पुनः कुल लागत (TC) के बराबर होता है। इसे सम-विच्छेद बिंदु कहा जाता है, जहाँ न हानि है और न लाभ। उत्पादन मात्रा OL के बाद, यदि फर्म अधिक उत्पादन करती है और लागत बढ़ जाती है, जिसके परिणामस्वरूप आगम कम होता है, अर्थात TC > TR, तो फर्म को हानि उठानी पड़ती है। कुल आगम (TR) वक्र x-अक्ष के नीचे होता है। लाभ ऋणात्मक होता है और फर्म को हानि दर्शाता है।
दिए गए ग्राफ में, फर्म का संतुलन उत्पादन मात्रा OQ पर है, क्योंकि यहाँ कुल आगम (TR) और कुल लागत (TC) के बीच का अंतर अधिकतम है। लाभ मात्रा SQ अधिकतम है।
व्याख्या: यह ग्राफ अपूर्ण प्रतिस्पर्धा और एकाधिकार बाजार में फर्म के संतुलन को दर्शाता है, जहाँ फर्म अधिकतम लाभ अर्जित करने के लिए उस उत्पादन स्तर पर उत्पादन करती है जहाँ TR और TC के बीच का अंतर सबसे अधिक होता है। यहाँ OQ संतुलन उत्पादन है और SQ अधिकतम लाभ है।
Producer's Equilibrium
The Producer's Equilibrium refers to the situation in which a producer maximizes his profits (or minimizes his loss) and has no intention to make any changes in his existing production or in his existing expenditure on means of production. The profit of a firm operating in a perfectly competitive market is maximized where the price line (AR = MR) intersects the MC curve and MC should be rising.
It is difficult to find the maximum distance between Total Revenue (TR) and Total Cost (TC) as the actual point is found only after drawing many tangents. It is not possible to find out per unit price on the basis of a graph, as price is not shown directly.
Perfect Competition Market
The Marginal Revenue is the extra income accrued to the firm on the sale of an extra unit of a commodity. In the same manner, Marginal Cost (MC) is the extra expenditure which the firm has to make for the production of an extra unit of a commodity.
MR (सीमान्त आगम) and MC (सीमान्त लागत)
Imperfect and Monopoly Market
Output Quantity is shown on the x-axis and Marginal Revenue (MR) and Marginal Cost (MC) are shown on the y-axis. In Imperfect Competition and Monopoly Markets, the Marginal Revenue curve slopes down while Marginal Cost slopes down initially and as the output units increase, the Marginal Cost (MC) also increases. The first condition of the firm's equilibrium is that Marginal Revenue (MR) be equal to Marginal Cost (MC). This is shown by the Equilibrium Price.
Y (सीमान्त आगम, सीमान्त लागत)
X (उत्पादन)
Q 30.
Answer:
If the Output Quantity is OM, then the Marginal Revenue (FM) is more as compared to Marginal Cost (GM). This increase is till Output Level OQ and EFG is the Profit Region. If the Level of Output is ON, the Marginal Revenue (HN) is More than Marginal Cost (IN). In this condition, the Firm sustains Loss (EHI). Thus, the Firm’s Equilibrium is at Point E, where MC = MR.
Perfect Competition Market:
At Point E, Marginal Revenue (MR) is Equal to Marginal Cost (MC) i.e. MR = MC. The first condition of the Equilibrium is Fulfilled here. The other condition of the MC Curve Intersecting MR Curve is also Fulfilled here. If the Firm determines Output Quantity OM, the First Condition is Fulfilled at Point F (MC = MR). But in the absence of the Second Condition, before Point F, Marginal Cost is Less than Marginal Revenue (MC < MR) and so the Firm Sustains Loss.
The Firm’s Equilibrium is at Output Level OQ, where both the Conditions are Fulfilled: (i) MC = MR and (ii) MC Curve Intersects MR Curve from Below.
The Marginal Revenue—Marginal Cost method is the Better Method as Maximum Profit and Output Quantity can be found out easily. These Methods to find out the Equilibrium of a Firm can be used in All Types of Markets.
साख नियंत्रण के तीन मात्रात्मक उपायों को विस्तार से समझाइये।
Explain Broadly any THREE Quantitative Methods of Credit Control.
OR
साख नियंत्रण के तीन गुणात्मक उपायों को विस्तार से समझाइये।
Explain Broadly any THREE Qualitative Methods of Credit Control.
[6 Marks]
साख नियंत्रण के मात्रात्मक उपाय:
इन उपायों से प्रत्यक्ष रूप से कुल साख की मात्रा पर प्रभाव पड़ता है। ये उपाय केवल साख की मात्रा पर विशेष ध्यान देते हैं, न कि साख की दिशा पर। जब देश की अर्थव्यवस्था में मुद्रा की तरलता की मात्रा का आधिक्य अथवा कमी हो जाती है, तो केन्द्रीय बैंक साख की मात्रा एवं लागत को नियंत्रित करने के लिए जिन उपायों को अपनाता है, उन्हें मात्रात्मक या परिणामात्मक उपाय कहा जाता है।
- बैंक दर नीति: बैंक दर वह है, जिस दर पर केन्द्रीय बैंक अपने व्यापारिक बैंकों को ऋण उपलब्ध करवाता है। बैंक दर वह दर है जिस पर केन्द्रीय बैंक व्यापारिक बैंकों के विनिमय बिलों की पुनर्कटौती करता है। भारत में यह कार्य भारतीय रिजर्व बैंक द्वारा किया जाता है। जब देश में साख की मात्रा कम करनी होती है, तब केन्द्रीय बैंक बैंक दर को बढ़ा देता है। इसके विपरीत, साख का विस्तार करने के लिए बैंक दर घटा दी जाती है।
- खुले बाजार की क्रियाएँ: केन्द्रीय बैंक बाजार में सरकारी प्रतिभूतियों को खरीदकर या बेचकर साख की मात्रा को नियंत्रित करता है। प्रतिभूतियाँ बेचने से बैंकों की नकदी कम होती है और साख सीमित होती है, जबकि खरीदने से नकदी बढ़ती है और साख का विस्तार होता है।
- नकद आरक्षित अनुपात (CRR): केन्द्रीय बैंक व्यापारिक बैंकों को अपनी कुल जमाओं का एक निश्चित प्रतिशत नकद के रूप में अपने पास रखने का आदेश देता है। CRR बढ़ाने से बैंकों की उधार देने की क्षमता कम हो जाती है, जिससे साख संकुचित होती है। CRR घटाने से साख का विस्तार होता है।
ये तीन मात्रात्मक उपाय केन्द्रीय बैंक को अर्थव्यवस्था में साख की कुल मात्रा को प्रभावी ढंग से नियंत्रित करने में सहायता करते हैं।
साख नियंत्रण के उपाय
(iii) खुले बाजार की क्रियाएँ
केन्द्रीय बैंक द्वारा सरकारी प्रतिभूतियों को खरीदने व बेचने की क्रिया को खुले बाजार की क्रियाएँ कहा जाता है। जब अर्थव्यवस्था में साख की मात्रा कम करनी होती है, तो केन्द्रीय बैंक अपने पास संचित प्रतिभूतियों को वाणिज्यिक बैंकों को बेचना शुरू कर देता है। इसके विपरीत यदि केन्द्रीय बैंक सरकारी प्रतिभूतियों को खरीदना शुरू करता है तो बैंकों के पास नकद कोषों में वृद्धि हो जाती है। इससे अर्थव्यवस्था में साख का विस्तार होता है।
नकद कोषानुपात व वैधानिक तरलतानुपात में परिवर्तन
व्यापारिक बैंकों द्वारा अपनी जमाओं का एक निश्चित अनुपात धनराशि के रूप में केन्द्रीय बैंक के पास रखना अनिवार्य होता है, जिसे वैधानिक तरलतानुपात कहते हैं। बैंकिंग विधान के अनुसार बैंकों को अपनी कुल सम्पत्ति का एक निश्चित अनुपात अपने पास तरल या नकद रूप में रखना अनिवार्य होता है, जिसे नकद कोषानुपात (CRR) कहते हैं। जब केन्द्रीय बैंक को साख का विस्तार करना होता है तो उक्त दोनों अनुपातों को कम कर दिया जाता है एवं इसके विपरीत जब साख का संकुचन या कमी करनी होती है तो उक्त अनुपातों में वृद्धि कर दी जाती है।
अथवा
साख नियंत्रण के गुणात्मक उपाय
केन्द्रीय बैंक द्वारा साख नियंत्रण हेतु गुणात्मक उपाय भी अपनाए जाते हैं जिनका उद्देश्य अर्थव्यवस्था के विशिष्ट क्षेत्र में साख को सीमित करने का होता है। साख का प्रवाह अनुत्पादक से उत्पादक क्षेत्र की तरफ करने के लिए चयनात्मक साख नियंत्रण रीतियों द्वारा किया जाता है।
(i) चयनात्मक साख नियंत्रण
केन्द्रीय बैंक द्वारा विशिष्ट क्षेत्रों एवं विशिष्ट आवश्यकता वाले समूहों के लिए चयनात्मक साख के नियंत्रण के उपाय अपनाए जाते हैं, जो इस प्रकार हैं:
- ऋण की सीमाओं में परिवर्तन करना।
- विनिमय बिलों की ब्याज दरों/कटौती दरों में भिन्नता रखना।
- विशिष्ट क्षेत्रों में ऋणों की जाँच व नियंत्रण।
- विलासिता पूर्ण वस्तुओं के ऋण की अलग से सीमा निर्धारण करना।
(ii) साख की राशनिंग
इसके अन्तर्गत केन्द्रीय बैंक के द्वारा भिन्न-भिन्न क्षेत्रों के लिए साख की राशनिंग (अधिकतम सीमा निर्धारण) कर दी जाती है। यह सीमा बैंक के अनुसार अलग-अलग निर्धारित की जा सकती है। जैसे:
- किसी बैंक के लिए बिलों को पुनः भुनाने की सुविधा को सीमित कर देना।
- सभी बैंकों के लिए बिलों को पुनः भुनाने की सुविधा को सीमित कर देना।
- बैंकों द्वारा विभिन्न उद्योगों अथवा व्यवसायों को दिए जाने वाले ऋण की सीमा अथवा कोटा निश्चित कर देना।
नैतिक दबाव (Moral Suasion)
नैतिक दबाव के अन्तर्गत केन्द्रीय बैंक व्यापारिक बैंकों को सलाह व मार्गदर्शन प्रदान करता है और केन्द्रीय बैंक अपने अधीनस्थ व्यापारिक बैंकों को सद्भाव व नैतिक अनुनय से भी अपनी साख नियंत्रित करने के लिए दबाव बना सकता है।
साख नियंत्रण की तीन मात्रात्मक विधियाँ (Quantitative Methods of Credit Control)
1. खुले बाजार की क्रियाएँ (Open Market Operations)
खुले बाजार की क्रियाएँ केन्द्रीय बैंक द्वारा खुले बाजार में सरकारी प्रतिभूतियों की बिक्री और खरीद को संदर्भित करती हैं।
- यदि केन्द्रीय बैंक सरकारी प्रतिभूतियाँ बेचता है, तो व्यापारिक बैंकों की जमाएँ कम हो जाती हैं और इसके कारण व्यापारिक बैंकों की साख निर्माण क्षमता भी कम हो जाती है। इस प्रकार, व्यापारिक बैंकों द्वारा साख निर्माण भी कम हो जाता है।
- यदि केन्द्रीय बैंक खुले बाजार से सरकारी प्रतिभूतियाँ खरीदता है, तो व्यापारिक बैंकों की जमाएँ बढ़ जाती हैं और इसके कारण व्यापारिक बैंकों की साख निर्माण क्षमता भी बढ़ जाती है। इस प्रकार, व्यापारिक बैंकों द्वारा साख निर्माण भी बढ़ जाता है।
अर्थव्यवस्था में मुद्रास्फीति की स्थिति में केन्द्रीय बैंक सरकारी प्रतिभूतियाँ बेचता है और मुद्रास्फीति की स्थिति में केन्द्रीय बैंक समस्याओं को नियंत्रित करने के लिए सरकारी प्रतिभूतियाँ खरीदता है।
2. वैधानिक तरलता अनुपात (Statutory Liquidity Ratio - SLR)
वैधानिक तरलता अनुपात बैंक जमाओं के उस न्यूनतम प्रतिशत को संदर्भित करता है जिसे अपने पास नकदी के रूप में रखना आवश्यक है। यह अनुपात केन्द्रीय बैंक द्वारा निर्धारित किया जाता है।
- यदि केन्द्रीय बैंक SLR बढ़ाता है, तो व्यापारिक बैंकों को अपनी जमाओं का अधिक प्रतिशत अपने पास रखना होता है, जिसका अर्थ है कि उनकी साख निर्माण क्षमता कम हो जाएगी। इस प्रकार, व्यापारिक बैंकों द्वारा साख निर्माण भी कम हो जाता है।
- यदि केन्द्रीय बैंक SLR घटाता है, तो व्यापारिक बैंकों को अपनी जमाओं का कम प्रतिशत अपने पास रखना होता है, जिसका अर्थ है कि उनकी साख निर्माण क्षमता बढ़ जाएगी। इस प्रकार, व्यापारिक बैंकों द्वारा साख निर्माण भी बढ़ जाता है।
अर्थव्यवस्था में मुद्रास्फीति की स्थिति में केन्द्रीय बैंक SLR बढ़ाता है और मुद्रास्फीति की स्थिति में केन्द्रीय बैंक समस्याओं को नियंत्रित करने के लिए SLR घटाता है।
3. नकद आरक्षित अनुपात (Cash Reserve Ratio - CRR)
नकद आरक्षित अनुपात बैंक जमाओं के उस न्यूनतम प्रतिशत को संदर्भित करता है जिसे केन्द्रीय बैंक के पास रखना आवश्यक है। सभी व्यापारिक बैंकों को अपनी जमाओं का एक निश्चित प्रतिशत न्यूनतम नकद आरक्षित अनुपात के रूप में केन्द्रीय बैंक के पास रखना होता है। यह अनुपात केन्द्रीय बैंक द्वारा निर्धारित किया जाता है।
- यदि केन्द्रीय बैंक CRR बढ़ाता है, तो व्यापारिक बैंकों को अपनी जमाओं का अधिक प्रतिशत केन्द्रीय बैंक के पास रखना होता है, जिसका अर्थ है कि उनकी साख निर्माण क्षमता कम हो जाएगी। इस प्रकार, व्यापारिक बैंकों द्वारा साख निर्माण भी कम हो जाता है।
- यदि केन्द्रीय बैंक CRR घटाता है, तो व्यापारिक बैंकों को अपनी जमाओं का कम प्रतिशत केन्द्रीय बैंक के पास रखना होता है, जिसका अर्थ है कि उनकी साख निर्माण क्षमता बढ़ जाएगी। इस प्रकार, व्यापारिक बैंकों द्वारा साख निर्माण भी बढ़ जाता है।
अर्थव्यवस्था में मुद्रास्फीति की स्थिति में केन्द्रीय बैंक CRR बढ़ाता है और मुद्रास्फीति की स्थिति में केन्द्रीय बैंक समस्याओं को नियंत्रित करने के लिए CRR घटाता है।
Qualitative Measures of Credit Control
Qualitative measures include those measures of the central bank which control the direction of credit creation in the economy. They are also termed as selective measures. It includes:
- Margin Requirement: The difference between the value of security and the amount of loan sanctioned is known as margin requirement. By changing the margin requirement, the central bank can increase or decrease credit creation in desired directions. If the central bank wants to increase credit for a particular use, it will decrease the margin requirement for that use.
- Consumer Credit: Loans given by commercial banks to consumers to purchase durable consumer goods are known as consumer's credit. The central bank can make the loans attractive or unattractive by:
- (a) Changing the minimum down payments
- (b) Changing the maximum period of repayment (installment)
- Differentiated Rate of Interest: The central bank can decide different interest rates for different uses to affect the direction of credit. The central bank will increase the rate of interest for those uses where it wants to discourage credit and will decrease the rate of interest for those uses where it wants to encourage credit.
Explanation: In the condition of inflation in the economy, the central bank increases the CRR (Cash Reserve Ratio) to reduce the money supply. In the condition of deflation in the economy, the central bank decreases the CRR to increase the money supply and control the problems. Qualitative measures, on the other hand, are selective tools used by the central bank to regulate the direction of credit rather than its total volume.